

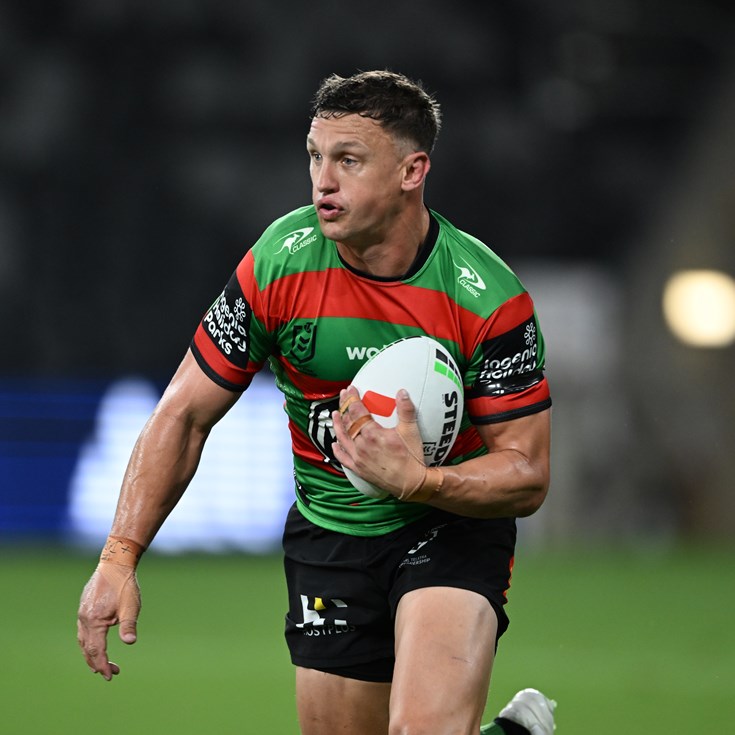
Jack Wighton
Centre
Player Bio
- Height:
- 190 cm
- Date of Birth:
- 04 February 1993
- Weight:
- 96 kg
- Birthplace:
- Orange, NSW
- Age:
- 32
- Nickname:
- Jackie Legs
- Debut Club:
- Canberra Raiders
- Date:
- 10 March 2012
- Opposition:
- Gold Coast Titans
- Round:
- 2
- Previous Club:
- Canberra Raiders
- Junior Club:
- -
- Biography:
In his inaugural season with the Rabbitohs, Jack Wighton made an immediate impact, claiming both the prestigious George Piggins Medal as the Club's Best and Fairest player for 2024 and the Jack Rayner Players’ Player Award. A powerful and dynamic player, Wighton is celebrated for his wide-ranging skill set, and his reputation as a big hitter and aggressive enforcer on the field. Building on his outstanding debut year at the Rabbitohs, Wighton is focused on continuing to drive South Sydney forward with his leadership, versatility, and relentless work ethic.
Career
- Appearances
- 275
- Tries
- 87
2025 Season
- Appearances
- 12
Scoring
- Tries
- 6
Attack
- Try Assists
- 3
- Line Breaks
- 4
- Tackle Breaks
- 21
Passing
- Receipts
- 307
Defence
- Tackles Made
- 164
- Missed Tackles
- 19
- Tackle Efficiency
-
Running Metres
- Average Running Metres
- 104
- Total Running Metres
- 1252
Fantasy
- Total Points
- 373
- Average Points
- 31.1
2025 Season - By Round
| Round | Opponent | Score | Position | Minutes Played | Tries | Goals | 1 Point Field Goals | 2 Point Field Goals | Points | Kicking Metres | Forced Drop Outs | Try Assists | Linebreaks | Tackle Breaks | Post Contact Metres | Offloads | Receipts | Tackles Made | Missed Tackles | Total Running Metres | Hit Up Running Metres | Kick Return Metres | |
|---|---|---|---|---|---|---|---|---|---|---|---|---|---|---|---|---|---|---|---|---|---|---|---|
| 1 | Dolphins | Won | 16 - 14 | Centre | 80 | - | - | - | - | - | - | - | 1 | - | 1 | 36 | - | 19 | 19 | 2 | 122 | - | - |
| 3 | Sharks | Lost | 27 - 12 | Centre | 80 | 1 | - | - | - | 4 | 31 | - | - | - | - | 24 | 1 | 18 | 8 | 3 | 66 | - | - |
| 4 | Panthers | Won | 28 - 18 | Centre | 80 | - | - | - | - | - | - | - | 1 | - | 2 | 41 | - | 24 | 9 | 4 | 136 | 5 | - |
| 5 | Roosters | Won | 20 - 14 | Centre | 80 | - | - | - | - | - | - | - | - | - | 1 | 32 | - | 15 | 10 | 1 | 96 | - | - |
| 6 | Cowboys | Lost | 16 - 24 | Centre | 80 | - | - | - | - | - | - | - | - | - | - | 42 | - | 14 | 17 | - | 98 | 12 | - |
| 7 | Bulldogs | Lost | 32 - 0 | Centre | 80 | - | - | - | - | - | 31 | - | - | - | 1 | 27 | - | 25 | 18 | 1 | 64 | 9 | - |
| 8 | Storm | Lost | 24 - 16 | Centre | 80 | 2 | - | - | - | 8 | 103 | - | - | 2 | 5 | 56 | 1 | 28 | 15 | 3 | 174 | 5 | - |
| 14 | Raiders | Lost | 36 - 12 | Centre | 80 | - | - | - | - | - | - | - | - | - | 1 | 41 | - | 17 | 7 | - | 119 | - | - |
| 15 | Bulldogs | Lost | 18 - 24 | Centre | 80 | 1 | - | - | - | 4 | 50 | - | - | - | 3 | 36 | - | 16 | 13 | 2 | 102 | - | - |
| 16 | Storm | Lost | 24 - 25 | Five-Eighth | 84 | - | - | - | - | - | 174 | - | - | - | 2 | 14 | - | 42 | 20 | - | 48 | - | - |
| 17 | Dolphins | Lost | 50 - 28 | Centre | 80 | 2 | - | - | - | 8 | 50 | - | - | 2 | 5 | 47 | - | 32 | 13 | 1 | 155 | - | - |
| 18 | Sea Eagles | Lost | 30 - 12 | Five-Eighth | 80 | - | - | - | - | - | 224 | 1 | 1 | - | - | 17 | - | 57 | 15 | 2 | 70 | - | - |
Career By Season
| Year | Played | Won | Lost | Drawn | Win % | Tries | Goals | 1 Point Field Goals | 2 Point Field Goals | Points | Kicking Metres | Kicking Metres Average | Goal Conversion Rate | Forced Drop Outs | Try Assists | Linebreaks | Receipts | Tackles Made | Missed Tackles | Tackle Efficiency | Total Running Metres | Average Running Metres | Kick Return Metres | Total Points | Average Points | |
|---|---|---|---|---|---|---|---|---|---|---|---|---|---|---|---|---|---|---|---|---|---|---|---|---|---|---|
| Raiders | 2012 | 9 | 4 | 5 | - | 44% | 2 | - | - | - | 8 | 36 | 4.00 | - | - | 1 | 6 | - | 82 | 17 | 82.83% | 783 | 87.00 | 100 | - | - |
| Raiders | 2013 | 18 | 7 | 11 | - | 39% | 4 | - | - | - | 16 | - | - | - | - | 1 | 4 | 215 | 171 | 16 | 81.72% | 1,641 | 91.00 | 145 | 450 | 25.0 |
| Raiders | 2014 | 20 | 7 | 13 | - | 35% | 6 | - | - | - | 24 | 1,900 | 94.99 | - | 2 | 6 | 9 | 464 | 277 | 38 | 83.97% | 1,881 | 94.00 | 293 | 597 | 29.8 |
| Raiders | 2015 | 21 | 9 | 12 | - | 43% | 7 | - | - | - | 28 | 378 | 18.00 | - | 1 | 6 | 10 | 472 | 126 | 30 | 80.77% | 3,036 | 144.00 | 1,189 | 803 | 38.2 |
| Raiders | 2016 | 26 | 18 | 7 | 1 | 69% | 8 | - | - | - | 32 | 381 | 14.67 | - | 2 | 13 | 9 | 652 | 104 | 28 | 65.32% | 3,569 | 137.00 | 1,083 | 892 | 34.3 |
| Raiders | 2017 | 23 | 11 | 12 | - | 48% | 7 | - | - | - | 28 | 134 | 5.83 | - | - | 9 | 10 | 588 | 106 | 27 | 79.70% | 3,757 | 163.00 | 1,181 | 797 | 34.6 |
| Raiders | 2018 | 13 | 5 | 8 | - | 38% | 3 | - | - | - | 12 | 158 | 12.16 | - | - | 8 | 3 | 351 | 46 | 13 | 77.97% | 1,771 | 136.00 | 516 | 426 | 32.8 |
| Raiders | 2019 | 26 | 16 | 10 | - | 62% | 9 | - | - | - | 36 | 6,293 | 242.05 | - | 15 | 5 | 9 | 1,116 | 451 | 68 | 86.90% | 2,826 | 108.00 | 173 | 1,240 | 47.7 |
| Raiders | 2020 | 22 | 15 | 7 | - | 68% | 13 | - | - | - | 52 | 6,089 | 276.77 | - | 8 | 8 | 11 | 941 | 433 | 45 | 90.59% | 2,244 | 102.00 | 26 | 1,196 | 54.4 |
| Raiders | 2021 | 21 | 8 | 13 | - | 38% | 5 | - | - | - | 20 | 5,069 | 241.39 | - | 7 | 10 | 4 | 830 | 451 | 53 | 89.48% | 1,758 | 83.00 | 45 | 1,013 | 48.2 |
| Raiders | 2022 | 21 | 10 | 11 | - | 48% | 4 | - | - | - | 16 | 5,926 | 282.21 | - | 15 | 10 | 4 | 949 | 417 | 70 | 85.63% | 2,104 | 100.00 | 153 | 966 | 46.0 |
| Raiders | 2023 | 22 | 11 | 11 | - | 50% | 7 | - | - | - | 28 | 3,315 | 150.67 | - | 2 | 6 | 9 | 836 | 376 | 67 | 84.88% | 2,229 | 101.00 | 32 | 851 | 38.7 |
| Rabbitohs | 2024 | 21 | 7 | 14 | - | 33% | 6 | - | - | - | 24 | 3,933 | 187.30 | - | 1 | 5 | 8 | 711 | 278 | 55 | 83.48% | 2,563 | 122.00 | 89 | 826 | 39.3 |
| Rabbitohs | 2025 | 12 | 3 | 9 | - | 25% | 6 | - | - | - | 24 | 664 | 55.32 | - | 1 | 3 | 4 | 307 | 164 | 19 | 89.62% | 1,252 | 104.00 | - | 373 | 31.1 |
Career Overall
| Year Start | Year End | Played | Won | Lost | Drawn | Win % | Tries | Goals | 1 Point Field Goals | 2 Point Field Goals | Points | Kicking Metres | Kicking Metres Average | Goal Conversion Rate | Forced Drop Outs | Try Assists | Linebreaks | Receipts | Tackles Made | Missed Tackles | Tackle Efficiency | Total Running Metres | Average Running Metres | Kick Return Metres | Total Points | Average Points | |
|---|---|---|---|---|---|---|---|---|---|---|---|---|---|---|---|---|---|---|---|---|---|---|---|---|---|---|---|
| Raiders | 2012 | 2023 | 242 | 121 | 120 | 1 | 50% | 75 | - | - | - | 300 | 29,664 | 122.58 | - | 51 | 83 | 88 | 7,413 | 3,039 | 472 | 86.56% | 27,602 | 114.00 | 4,940 | 9,221 | 39.6 |
| Rabbitohs | 2024 | 2025 | 33 | 10 | 23 | - | 30% | 12 | - | - | - | 48 | 4,597 | 139.31 | - | 2 | 8 | 12 | 1,018 | 442 | 74 | 85.66% | 3,815 | 115.00 | 89 | 1,199 | 36.3 |
Latest

Team Mates


National Rugby League respects and honours the Traditional Custodians of the land and pay our respects to their Elders past, present and future. We acknowledge the stories, traditions and living cultures of Aboriginal and Torres Strait Islander peoples on the lands we meet, gather and play on.


